Thursday, December 30, 2010

How much time do American kids spend doing homework?

The American Time Use Survey is valuable dataset operated by the Bureau of Labor Statistics. Each year it asks a large, representative sample of Americans to keep time-diaries, writing down exactly what they do during the day.

I am going to rely on time survey data to give us hints about PISA test-scores. PISA is taken only by those aged 15-year, but let's examine all kids aged 15-18, both to increase the sample size and because high-school is more important. I will only include 15-18 year olds who are enrolled full time in high-school.


I think the graph and the implications for educational outcomes are pretty self-explanatory, even though I will admit that I was (again) surprised by just how large the differences are.

The only thing I would like to caution is not to assume a 1-1 causal relationship between input and output: kids who are better at school anyway may also study more, getting a double-advantage so to speak.

This graph is worth keeping in mind next time you read that the Asian school system rather than Asian culture explains Asian educational outcomes. These are Asian-Americans under (largely) the same American public school system that the media has decided is the cause of Americas problems. With American teachers, American teacher unions, with typical American levels of education funding, and facing the same American lack of school choice.

The Asian school system was if I understand the history correctly originally a carbon-copy of western school systems. They may have retained more class-room discipline, and more memorization, but other than that there appears nothing magic about the schools themselves.

We have to look at the society outside the classroom if we want to explain the differences in outcome. Instead of mindlessly assuming all variation in output is due to education policy, one single input of the human capital production function.

Wednesday, December 22, 2010

The amazing truth about PISA scores: USA beats Western Europe, ties with Asia.


What I have learned recently and want to share with you is that once we correct (even crudely) for demography in the 2009 PISA scores, American students outperform Western Europe by significant margins and tie with Asian students.
Jump to the graphs if you don't want to read my boring set-up and methodology.

The main theme in my blog is that we shouldn’t confuse policy with culture, and with demographic factors.

For instance, education scholars have known for decades that the home environment of the kids and the education levels of the parents are very important for student outcomes. We also know that immigrant kids have a more difficult time at school, in part because they don’t know the language.

Take me as an example. The school me and my brother attended was in a basement in Tehran, had no modern resources, and largely focused on religious indoctrination. But we had a good home background. Our father attended a college in the west a few years (our mother didn’t, despite stratospheric scores test scores, because at the time you didn’t send a good Kurdish girl to another city to study). So we did well in school. Conversely, the first few years in Sweden I had bad grades, in part because I didn’t master the language.

The point I am trying to make is that the school in Sweden was objectively superior to the school in Iran. But I scored lower in Sweden, because of factors outside the control of the education system. If you want to compare the effect of the school, you have to isolate those external factors and make an apples-to-apples comparison.

However, this is not at all how the media is presenting the recent PISA scores. For example there is a lot of attention of the score of the kids in Shanghai, the according to the NYT is supposed to “stun” us or something.

It's dumb to compare one of the most elite cities in a country with entire nations, and to draw policy-inference from such a comparison. Shanghai has 3 times the average income of China! It is also naive to trust the Chinese government when they tell us the data is representative of the entire nation. Either you compare Shanghai to New York City, or you compare the entire country of China, including the rural part, with other large nations. Most of the news and policy conclusions we read about PISA-scores in the New York Times is thus pure nonsense.

1. Correcting for the demography:


In almost all European countries, immigrants from third world countries score lower than native born kids.

Why? No one know exactly why. Language, culture, home environment, income of parents, the education level of the parents and social problems in the neighborhood and peer groups norms are among likely explanations. But it is generally not true that the schools themselves are worse for immigrants than natives. In welfare states, immigrants often (thought not always) go to the same or similar schools and have as much or likely more resources per student.

So the fact that immigrant students in mixed schools do worse than Swedish kids used to a few decades ago in homogeneous schools does not it out of itself prove that Swedish public schools have become worse.

Of course, the biggest myth that the media reporting of PISA scores propagates is that the American public school system is horrible.

The liberal left in U.S and in Europe loves this myth, because they get to demand more government spending, and at the same time get to gloat about how much smarter Europeans are than Americans. The right also kind of likes the myth, because they get to blame social problems on the government, and scare the public about Chinese competitiveness.

We all know that Asian students beat Americans students, which "proves" that they must have a better education system. This inference is considered common sense among public intellectuals. Well, expect for the fact that Asian kids in the American school system actually score slightly better than Asian kids in North-East-Asia!

So maybe it’s not that there is something magical about Asian schools, and has more to do with the extraordinary focus on education in Asian culture, with their self-discipline and with their favorable home environment.

There are 3 parts to the PISA test, Reading, Math, and Science. I will just make it simple and use the average score of the 3 tests. This is not strictly correct, but in practice it doesn’t influence the results, while making it much easier for the reader. (the reason it doesn't influence the results is that countries that are good at one part tend to be good at other parts of the test.)

The simplest thing to do in order to get an apples-to-apples comparison is to at least correct for demography and cultural background. For instance, Finland scores the best of any European country. However first and second generation immigrant students in Finland do not outperform native Swedish, and score 50 points below native Finns (more on this later).

On PISA, 50 points is a lot. To give you a comparison, 50 points is larger than the difference between Sweden and Turkey. A crude rule of thumb here is that 50 points is 0.5 standard deviations.

The problem is that different countries have different share of immigrants. Sweden in 2009 PISA data had 17%, and Finland 4%. It’s just not fair to the Swedish public school system to demand that they must produce the same outcome, when Sweden has many more disadvantaged students. Similarly schools with African-American students who are plagued by racism, discrimination, crime, broken homes, poverty and other social problems are not necessarily worse just because their students don’t achieve the same results as affluent suburbs of Chicago. In fact, the most reliable data I have seen suggests that American minority schools on average have slightly more money than white schools. It’s just that the social problems they face are too much to overcome for the schools. It is illogical to blame the public school system for things out of its hands.

So let’s start by removing those with foreign background immigrants from the sample when comparing European countries with each other. I define immigrants here as those with a parent born outside the country, so it includes second generation immigrants. This is fairly easy for Europe.

In the case of America, 99% of the population originates from other countries, be they England, Italy, Sweden, India, Africa, Hong-Kong or Mexico. If we want to isolate the effect of the United States public school system, we should compare the immigrant groups with their home country. For those majority of Americans whose ancestors originate from Europe, we obviously want to compare them with Europe. For some groups, such as Indians, this is inappropriate. The reason is that mainly the most gifted Indians get to migrate to America to work or study.

However, as I have argued previously, there is strong reason to believe that this problem of so called biased selection does not apply to historic European migration to the United States at the aggregate level. The people who left Europe were not better educated than those who stayed. Immigrants were perhaps more motivated, but often poorer than average.

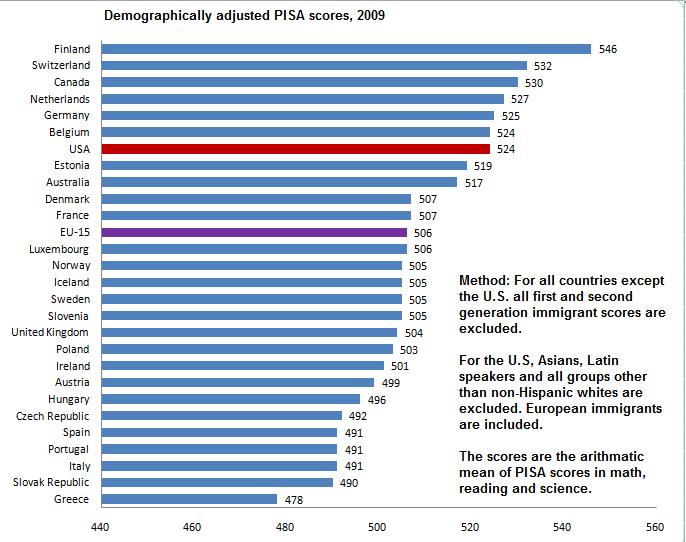
So similar to my comparison of GDP levels, let us compare Americans with European ancestry (about 65% of the U.S population, and not some sort of elite) with Europeans in Europe. We remove Asians, Mexicans, African-Americans and other countries that are best compared to their home nations. In Europe, we remove immigrants.

The results are astonishing at least to me. Rather than being at the bottom of the class, United States students are 7th best out of 28, and far better than the average of Western European nations where they largely originate from.


The mean score of Americans with European ancestry is 524, compared to 506 in Europe, when first and second generation immigrants are excluded. So much for the bigoted notions that Americans are dumb and Europeans are smart. This is also opposed to everything I have been taught about the American public school system.

For Asian-American students (remember this includes Vietnam, Thailand and other less developed countries outside Northeast Asia), the mean PISA score is 534, same as 533 for the average of Japan, South Korea, Singapore and Hong Kong. Here we have two biases going in opposite directions: Asians in the U.S are selected. On the other hand we are comparing the richest and best scoring Asian countries with all Americans with origin in South and East Asia.


2. Policy-Implications


Libertarians in the United States have often claimed that the public school system (which has more than 90% of the students) is a disaster. They blame this on government control and on teachers unions. However, it is completely unfair to demand that a public school in southern California where most of the students are recent immigrants from Mexico whose parents have no experience in higher education (only 4% of all Mexican immigrates have a college degree, compared to over 50% of Indian immigrants) should perform as well as a private school in Silicon Valley.

The libertarians have no answer why European and Asian countries that also have public school systems score higher than the United States (unadjusted for demography). Top scoring Finland has strong teacher unions, just as California.

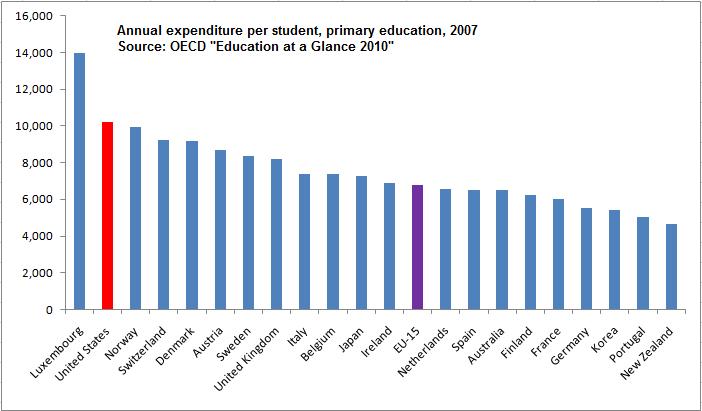
Similarly, the left claims that the American education system is horrible, because Americans don’t invest enough in education. The left has no answer when you point out that the United States spends insanely more than Europe and East Asia on education. According to the OECD, the United States spends about 50% more per pupil than the average for Western Europe, and 40% more than Japan.


Another policy implication is that Europe can learn from American public schools, which appear to be better than most European countries. I can only compare Sweden with the U.S, but I can tell you that from my experience, the American system is superior. I always thought this was just anecdotal evidence, but I am beginning to realize that American schools are indeed better.

For example, we don’t have any real equivalent to Advanced Placements classes. We have cheaper and worse textbooks. The teachers on average have far less education. I could go on.

Nor is it any longer a mystery to me why Americans spend so much more on education and (falsely appear) to get out less in output.

But of course the biggest implication is that most Europeans and all American liberals have lost the bragging right about their side being smarter than Americans.

3. Immigrant PISA scores compared to natives


This is again the mean difference of the 3 parts of PISA.


Australia is the only country with a negative gap, which means Australian immigrants actually score better than natives. Canada is similar. The Australian-Canadian skill based migration system is at work here, generating less inequality (even short term).

The other pattern appears to be that the gap is almost constant in the remaining Western European countries. This may be important to keep in mind, whenever people claim that uniquely Swedish policies are causing poor immigrant educational outcomes.

Tuesday, December 21, 2010

The new 2012 electoral map after 2010 reapportionment

A Constitutional principe is that the Census determines the number of electoral votes for each state. The 2010 census numbers are now out.

The net result is that Republicans gain about 6 electoral seats, or one Nevada sized state.

Let us analyze the 2012 electoral map that I drew with the new electoral votes:


If the election is not close, such as in 2008, these details will not matter. But what if the election is close again?

I start with the Bush-Kerry 2004 map. It’s anyone’s guess what the swing states will be in 2012, and the colors in this map reflects mine.

Since Obama only managed to carry Ohio and Florida with small margins in a very Democratic year, and given his approval rating in those two states, I assume Ohio and Florida will be lost to him if the election is close (he will of course take them again if he wins with a large national margin again).

Republicans have targeted Pennsylvania, Wisconsin, Michigan and Washington State in the last elections. Since they failed every time, let’s assign those to Obama. I added New Hampshire to possible Republican pickups, because Bush is not on the ballot anymore.

The Red and Red-leaning States, plus the 6 new electoral votes after reapportionment, leave the Republicans with 253 electoral votes.

Since Republicans are likely to control the house in 2012, they need 269 electoral votes to win. So they need to get 16 electoral votes from the states in light purple (or from Pennsylvania, Wisconsin, Michigan or Washington) to defeat Obama.

Assuming they keep the red states, plus Virginia, the Republicans need to win only one of the following swing states:

Colorado (Cook Partisan index 0), or
Nevada (D+1), or
Iowa (D+1), or
New Hampshire (D+2), or
New Mexico (D+2)

For the first half of 2010, Gallup has calculated Obama's approval rating by state. I will just compare each state with the national average:

New Hampshire (-8).
Colorado (0)
Iowa (-1)
Nevada (-1)
New Mexico (+2)

Without reapportionment, the GOP would have to win two of the mid-sized ones, but now only one is enough. It seems New Hampshire and Colorado are the most likely swing states. If Obama carries all of those states; he also need to hold Pennsylvania and Michigan and Wisconsin and Washington. If he does this, he is re-elected.

Let me also give you the Cook partisan index and current approval rating for the less likely but still possible pickups mentioned above:

Wisconsin: Obama Approval (-1). Cook index (D+2)
Pennsylvania: Obama Approval (-1). Cook index (D+2)
Michigan: Obama Approval (+2). Cook index (D+4)
Washington: Obama Approval (+2). Cook index (D+5)

If the Republicans keep the core states plus Virginia (Cook R+2, Obama approval -1), and miss all of purple CO,NH,IO,NV and NM, they will still win by just carrying one of the four blue states above.

Here is a another way of understanding the effect of the 2010 reapportionment:

Before this, if Republicans would have won all the States with a Cook Partisan Index that leans Republican and the Democrats all the states that lean Dem, the Republicans would get 260 electoral votes, Dems 269, and 9 neutral. With must-have Colorado (which is the only state currently with a completely neutral partisan leaning), the Republicans would get 269 and win the presidency *if* they control the house.

Thus the Republicans had a slight structural disadvantage, the combined red and red-leaning states had 9 fewer electoral votes than the blue and blue-leaning states.

After reapportionment, winning the Cook republicans leaning states would give the Republicans 266, and the dems 263. If the Republicans also win neutral Colorado, they would have 275. The Republicans now enjoy a slight structural advantage over Democrats.

First of all, the Republicans no longer need to control the house in order to win with just the red states. Second, reapportionment gives them the strategic possibility to “trade” Colorado with one of the smaller light blue states such as New Hampshire, Nevada, New Mexico or Iowa. With reapportionment Colorado is no longer a must-have.

Lastly this is the list of States losing and winning, plus the Cook measure of how they lean (for example Texas got 4 more electoral votes, and has been +10 points more Republican than the national average in the two last presidential elections). The second number reflects the change in the number of house seat for the State, which naturally also leads to the same change in the number of electoral votes.


Republican Leaning states:

Utah (20R) +1
Texas (10R) +4
South Carolina (8R) +1
Georgia (7R) +1
Arizona (6R) +1
Florida (2R) +2
Louisiana (10R) -1
Ohio (1R) -2
Missouri (3R) -1

Democrat leaning States:

Washington (5D) +1
Massachusetts (12D) -1
New York (10D) -2
Illinois (8D) -1
Michigan (4D) -1
New Jersey (4D) -1
Pennsylvania. (2D) -1

Swing States

Iowa, (1D) -1
Nevada (1D) +1

Monday, December 20, 2010

Did Karl Rove manipulate Fredrik Reinfeldt to get Julian Assange arrested?

Today the Huffington Post, the flagship of the American liberal left, has an article claiming that Karl Rove had Sweden arrest Julian Assange.

It is clearly written by someone who understands little about Sweden:

1. The article claims that Karl Rove is a paid advisor to Fredrik Reinfeldt. This is simply not true.

Karl Roves involvement with the Swedish Conservative happened in the beginning of the 1980s, when Fredrik Reinfeldt was a teenager. Rove visited Sweden a couple of days to teach them about fundraising. This is according to Aftonbladet, Sweden’s largest anti-Reinfeldt paper.

Karl Rove also traveled to the Swedish vacation island of Gotland a couple of days in 2008 as a publicity stunt of the Swedish right-libertarians (Timbro). In fact, I was in the audience and chatted with Rove for a few minutes. However Fredrik Reinfeldt had absolutely nothing to do with this, and was not even present at the conference.

This trip appears to be the height of Karl Rove’s connection with Fredrik Reinfeldt!

If Rove has been an advisor to Reinfeldt, that would be huge news in Sweden. So where are links to the legitimate news stories? The “source” for the Huffington post is instead speculation from some paranoid Swedish leftist blogger.

2. The Huffington post gives their readers the impression that Reinfeldt is some sort of Swedish Republican, or at least very Republican friendly (which would make cooperation with Karl Rove realistic). This is an ignorant claim.

Reinfeldt is popular because he took the Swedish conservative party to the left, even changing the name to the “The New Moderates”. He famously cleansed the party of the right, abandoned the opposition to the welfare state, and changed its policy platform and rhetoric to the center (and obviously the center in Sweden is to the left of the center in the U.S).

The Huffington post is correct that Reinfeldt wrote a book criticizing the Swedish welfare state. However they neglect to tell their readers that he did this when he was 28, and that Reinfeldt repudiated his positions when he years later came to power .

4. Reinfeldt has always presented himself as a fan of President Obama, perhaps partially because Fredrik Reinfeldt himself has some black American ancestry, which he likes to point out.

When asked directly on TV before the 2008 election who he would prefer as the president of the United States, Reinfeldt alone of the seven Swedish party leaders said Barrack Obama. Everyone else prefered Hillary (naturally McCain got zero votes).

That Reinfeldt would prefer the Democrats is just logical, since Swedes both on the right and the left love Barrack Obama and hate George W Bush. Swedes are not only economically left, they are ultra-secular as well as pacifist.

When the Swedish public was polled in 2008 about Obama vs. McCain, the two party divide was 91% Obama vs. 9% McCain. Does that sound like a country where Karl Rove has a lot of influence over the judiciary?

5. The women who accuse Assange of rape are both anti-American, feminist activists. That’s how Assange met them.

I suppose it is theoretically possible for Karl Rove (directly or through Reinfeldt) to bribe two socialist Swedish girls to seduce Assange. But is that a realistic theory? Does Karl Rove control a privately owned espionage agency which has more reach than the CIA? For example, what if one of the leftist women Karl Rove approached would have chosen to reveal the operation instead?

So, where exactly is the E V I DE N C E for The Huffington Post's unlikely theory?

You still need evidence to make extraordinary claims, right?

If the Huffington Post has this evidence, I for one would love to read it. If they don’t, it’s a useful story to keep in mind the next time the Huffington Post decides to write about “The Paranoid Right” or about the “the paranoid, conspiracy-laden, resentful, self-hating troglodytes that form the foundation of the modern GOP”.

P.S

Picture from Sweden 2008, Almedalen Gotland (I am the second person from the left).

Friday, December 17, 2010

Iranian academic achievements

As a result of recent Iranian success in science and engineering there is some discussion about Iranian educational outcomes in the blogosphere.

Two semi-related comments:

1. Iranians in Sweden are currently the only major immigrant group that significantly outperforms native Swedes in higher education. Of course this is partially or entirely due to selection, but most other immigrant groups are also selected, and do not perform as well.

About 45% of native Swedes start college. The figure is a little over 30% for non-european immigrants as a whole. By contrast, 60% of Iranian immigrant kidds in Sweden start college. The figure for Iraqi immigrants is 26% and for Somali immigrants 16%.


Iranians are also overrepresented in selective programs, such as in medical school and in engineering. About 4% of all of Sweden's medical students and 2% of Sweden's PhD students originate from Iran.

Naturally, the success of this single non-European immigrant group (the exception) is used by the Swedish media as an argument to take in more unskilled immigrants from unsuccessful countries such as Iraq and Somalia (the rule). Classical Bait and Switch.

2. For some reason a lot of Americans are under the impression that Azeris constitute some sort of Iranian intellectual elite.

It is certainly true that Azeris are not second class citizens in Iran. It is also true that they are as stanchly nationalistic as most other Iranians and have little separatist tendencies (in both cases unlike Iranian Kurds).

But in my opinion it is misleading to describe Azeris as an elite.


The Mede provinces of Iran - Azeri and Kurdish - both have lower than average per capita income, even excluding the oil producing provinces.

Furthermore, I have never seen any evidence that Azeris are over-represented in Iranian academia, and some evidence that they are under-represented.

According to Iran’s Statistical Yearbook, the Azeri provinces are underrepresented in their national share of college students. This alone doesn’t tell us much since they could move to other cities to study, and because those Azeris who have already migrated to Tehran are not included.

Azeris are a little less than 20% of the population. The American estimate of 25% is often circulated, but self-identified survey data shows a smaller share. Non-Farsi speakers are probably a little less than half the population. Yet, according to this guy, research by Alireza Sarafi shows that only 10% of Iranian PhD students are non-farsi speakers.

Obviously Iranian official statistics is not all that reliable. However we need more than anecdotal evidence to claim that Azeris are over-represented among the Iranian elite.

Thursday, December 2, 2010

My job market page

I will be done with my PhD by the summer of 2011, so I am going on the job market this year. I am looking for academic jobs and for think tank positions.

Here is the link to my job market page. It includes the current version of my dissertation which I have been working on the last year, which is called: "Self-Employment does not measure Entrepreneurship".

Innovative Entrepreneurship and the growth of new firms is believed to be important by economists and by policy makers. However we generally lack good quality data on entrepreneurship, while there is plenty of data on self-employment. Therefore economists use the later to test theories on the former.

But how well does self-employment do as an empirical tool? During the two lasts years I have attempted to assemble two new datasets of entrepreneurship in order to contrast it with self-employment.

The first dataset is the per capita number of self-made billionaires who became rich by founding a new company. I investigate the source of wealth for around 1700 billionaires on Forbes list of the world's richest, identifying 996 entrepreneurs in 53 countries.

Second, as part of a large Swedish survey on twins, I added questions about aversion towards ambiguity (economists believe that entrepreneurs face more ambiguity or incalculable risk than salaried workers) as a question where I ask business owners to self-identify as entrepreneurs or self-employed based on the ambition to grow and innovate. Surprisingly, 80% of the self-employed do not consider themselves entrepreneurs.

What I find is that in many important applications, using self-employment as a proxy often gives you the opposite result you would get from using entrepreneurship data. Across countries, the rate of entrepreneurship is reversely related to the rate of non-agricultural self-employment.

Here is a picture for industrialized countries (the pattern is the same across all available countries).


The United States has 4 times higher rate of per capita entrepreneurs as western Europe. Using a different metric, 31% of the largest American firms were founded by individual entrepreneurs since World War II, compared to only 7% of the largest western European firms.

In contrast, the self-employment rate of western Europe is twice that of the United States.

Taxes, the level of regulations, the level of trust and the quality of institutions are examples of variables that are related in reverse ways between entrepreneurship and self-employment.

Within the United States, I point out that geographic locations with lots of entrepreneurship such as Silicon Valley and Boston have lower rates of self-employment, fewer employed in small firms, lower entry into business start up and lower firm density than the national average.

I find that immigrants, who tend to have higher rates of self-employment, have lower rates of high-impact entrepreneurship. 11% of Americas most successful entrepreneurs were born outside the U.S, even though the workforce is 16% foreign born.

While self-identified Swedish entrepreneurs indeed have higher tolerance of ambiguity than salaried workers, the self-employed do not. This is not that surprising once you consider that innovative entrepreneurship is faced with hard to calculate uncertainty about technology and demand, while self-employed, who are predominately carrying out familiar tasks, have higher risk but probably not much higher ambiguity as ordinary workers.

I develop a model to account for some of the patterns, pointing out that successful entrepreneurship tends to reduce self-employment as part of the process of economics development. This happens as more productive entrepreneurial firms absorb less productive self-employed. Similarly, in countries with business-friendly policies, the most talented individuals and firms grow and absorb many of the mom-and-pop operations, increasing entrepreneurship and reducing self-employment.

Similarly, when taxes are high and the economy regulated, it will be more difficult for entrepreneurial companies to emerge, and to grow rapidly and absorb less efficient companies. Instead such economies have lots of self-employed (who can more easier evade taxes and regulations). The empirical regularity that high tax levels and a heavy regulatory burden tend to be associated with high levels of self-employment (think of southern Europe and third world economies) should not be miss-interpreted as implying that taxes do not effect entrepreneurship.

Rather than treating small business and innovative Schumpeterian entrepreneurship as more or less synonymous, policy makers should be aware that they face a trade-off: either we pursue policies that give us more small business or we aim to encourage entrepreneurship.